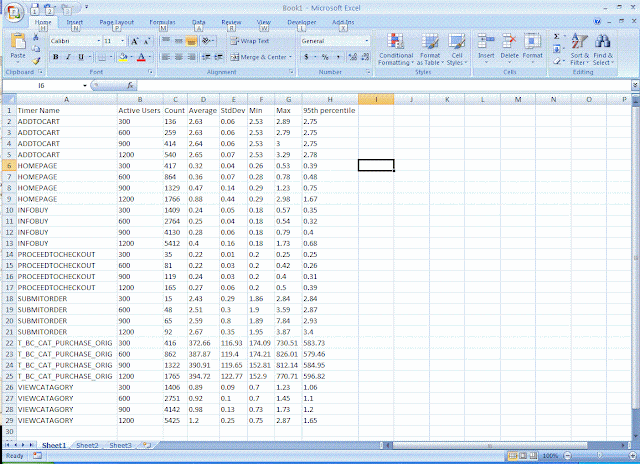
This method doesn't do any sort of interpolation and therefore requires at least 100 samples to give a reasonable result for percentiles. The base table of timers consists of the columns timername (type varchar), activeusers (number of active users at the time the timer was recorded, type int), and the 'elapsed time' of the event timed as a floating point number.
---------------------------------------------------------------------------------------------
select
timername as 'Timer Name',
activeusers as 'Active Users',
count(elapsedtime) as 'Count',
avg(elapsedtime) as 'Average',
stdev(elapsedtime) as 'StdDev',
min(elapsedtime) as 'Min',
max(elapsedtime) as 'Max',
(select max(elapsedtime) from
(select top 95 percent elapsedtime
from timers b
where b.timername = a.timername and b.activeusers = a.activeusers
order by b.elapsedtime asc) as elapsedtime) as '95th Percentile'
from timers a
where a.activeusers in (300,600,900,1200)
group by a.timername, a.activeusers
order by a.timername asc, a.activeusers asc
---------------------------------------------------------------------------------------------
After executing the query, I cut and paste the output to Excel.
Graphing count vs VUs gives show how throughput varies with load. Here is a graph of home page throughput.
And a graph of 95th percentile homepage response time vs VUs which indicates some sort of bottleneck above 900 VUs.


No comments:
Post a Comment