Wednesday, December 23, 2009

Using OpenSTA in the Amazon EC2 (part 3)

(...continued from Part 2)

In part 2 of this blog series, we started two instances and configured the opensta name servers so that one instance became the master and the other a slave. To make this example a little more interesting, I'll be illustrating a few concepts I discussed in my first blog on performance testing strategies.

For this exercise, the sample workload definition is as follows:

  • Script1 will be executed 30% of the time. It will access the home page for www.iperformax.com and record the elapsed time with a label of "homepage".
  • Script2 will be executed 60% of the time. It will access the page for services at http://www.iperformax.com/services.html and record the elapsed time with a label of "services".
  • Script3 will be executed 10% of the time. It will access the page for services at http://www.iperformax.com/testimonials.html and record the elapsed time with a label of "testimonials".
  • The average time spent viewing a page will be 4 minutes.
This test will be exploratory in nature. I don't have a specific load or service level objective to meet, but I do want to find the limits of my web site where a small increase in load results in a large degradation in response time. To do so,  I will run up to 2,400 virtual users. As I want to see how response time and throughput change vs load, I need to vary the load. I will take a stepwise approach where I ramp up 25% of peak load in the first 5 minutes and then allow the test to run in a steady state for 10 minutes. I will repeat this pattern 4 times. Afterwards, I will examine the response time and throughput for the four 10 minute periods where the load was constant (e.g. at 600, 1200, 1800, and 2400 virtual users).

This is not meant as an OpenSTA scripting tutorial (read more about mentoring, training, and support available from Performax), but I will post the master script that I developed for this example. Lets review where we are with respect to injectors, in the OpenSTA commander menu->Tools->Architecture Manager shows the following.
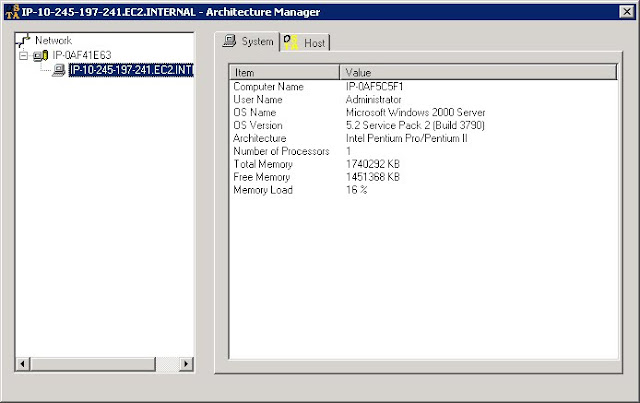


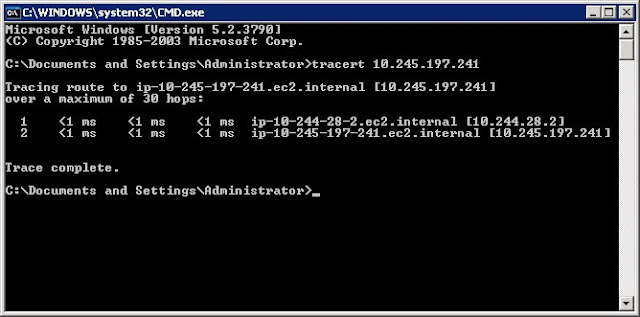
This output indicates that the master node's server name is IP-0AF41E63 and the slave (highlighted in reverse video) is named IP-0AF5C5F1. A good check to do at this point is verify that both master and slave are on the same subnet. To do so, I will initiate a trace route from the master node to the slave.


Indeed they are. In fact, they are on the same physical server. If on different servers, you would see at least two more hops. If on different subnets, the IP address outside of the 10.X.X.X range would NOT have identical values for the first 3 numbers (X.Y.Z.*) in the IP addresses. I have never launched multiple servers into the same region at the same time and had them end up on different subnets. While apparently rare, it can happen and any two servers located on different subnets will not work together in a master/slave distributed test as is being described here.

I have tried to add to a set of instances launched earlier in the day (same region) and found the new ones were on different subnets. If you think you will need 10 servers, launch them at the same time or you may have to start over. There is a way (OpenSTA daemon relay) to work around the subnet restriction, but it is beyond the scope of this post.

The astute reader will notice that these two addresses in the trace route output are not on the same subnet. Well, the REAL restriction (AFAIK) here is that the nodes must be able to send multi-cast messages to each other, and the way the network is implemented between VMs allow instances on the a physical machine to send multi-cast messages to each other even though their addresses may indicate they are on different subnet.

Ok, back to commander. I have created a master script. Since we are running a two server test, I will need to create two task groups. First I create a test called BLOG_TEST and then drag and drop  the master script onto the test grid under task1.


By default, this task group is assigned to localhost (the master server). Lets customize this task group to run half of the users and then clone it to also run on the slave. Click on the VUs column for task 1, and check the box to 'Introduce virtual users in batches' to open the batch start options dialog. I will assign 1,200 VUs according to the ramp-up I described earlier.


Next, I want to limit this test to 1 hour. I click on on the 'Start' column for task group 1 and select 'after fixed time' in the Stop Task Group drop down list box and enter a time limit of 1 hour (hh:mm:ss) in the Time Limit box.


The last step is to clone this task group (right mouse anywhere on the first task group and select 'duplicate task group') and change the HOST cell to IP-0AF5C5F1(the slave server name). I could also specify the ip address of the slave node here instead of typing the server name. The second task group is now a clone of the first, but will run from the slave.


Before we start here is a look at the master script that will run Blog_Scenario_1 30% of the time, Blog_Scenario_2 60% of the time and Blog_Scenario_3 10% of the time.


Here is the load profile produced by the test


There you have it. It took a lot longer to write this than it did to setup the instances, create the scripts, and run the test. I will be making my OpenSTA instance available via Amazon's EC2 in the near future. It comes with a special build of OpenSTA that is customized for .NET applications (large variable support and built in URL encoding) plus an OpenSTA script processor that does automated viewstate handling and allows creating scripts without hours of manually editing. For more information on using this instance or questions about projects, training or support, email me at bernie.velivis@iperformax.com


Bernie Velivis, President Performax Inc
Thursday, December 17, 2009

Using OpenSTA in the Amazon EC2 (part 2)

(...continued from Part 1)

The status of an instance changes to Running as it boots. It usually takes another ten to fifteen minutes before the instance is ready to accept logins. In this example, I will be creating a master node and a single slave. While these terms may not be used in the OpenSTA documentation, I define master node as the server that holds the test repository. The master node is used to control all aspects of a test using OpenSTA Commander as the primary interface.

Once started, both VMs are identical with the exception of their IP address and network name. To help me keep track of which server is which, I use the "tag" function to name each of instance. Right mouse on a server in the instance pane and choose "add tag". I'll designate the first one as master and the second as slave1 to help me keep track of their roles.


For each of the instances started, EC2 creates both internal (private) and external (public) addresses. For machines to talk to one another within the EC2, they must use either their private IP address or DNS name. To connect to these instances from outside the EC2, use the public IP or DNS name. If you right mouse over an instance, you can view its details, copy the details to the paste buffer, or simply "connect to instance" which starts the remote desktop program (RDP) and points it at the server you selected. You can also "get password" for a newly created AMI if one has not been assigned.

The first step in configuring the new instances is to connect to the master node using RDP. One of the first things you will be greeted with is a message that the OpenSTA name server has exited and you will be asked if you want to send an error report. Just cancel the dialogs. Whats happening here? When OpenSTA was installed on the AMI, it took note of the server name and ip address of the machine it was installed on and it remembers and uses that information to connect to the repository which holds all scripts, data, test definitions etc. The error message occurs because when the instance we just connected to was booted, it was assigned a new IP address. The name server (the background process that handles all the distributed communications) can't reach the repository due to stale information about the IP address of the repository host.

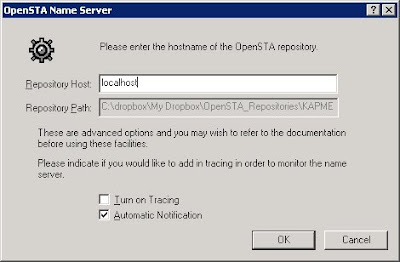
The fix is trivial, but must be done each time a system (master or slave) is started. It is also important what order the name servers are fixed and restarted. Starting with the master node, login, dismiss the error message, then right mouse on the name server icon in systray (looks like a green wheel) and select CONFIGURE. Enter 'localhost' in the dialog box for "repository host".


Note that I have also moved my repository to a different directory  (c:\dropbox\...). When an AMI is started, the C: drive reverts to the state it was in when the AMI was bundled. Any changes we make to the contents of C: will be LOST when this instance is shutdown. Rather inconvenient to create scripts, run tests, do all sorts of analysis only to have the files lost after we shut down. I have opted to use free software (dropbox) which replicates the contents of the dropbox directory (on a local drive) to a network drive (no doubt somewhere in dropbox's cloud). On my office PC, I run dropbox to replicate from this network drive to a local drive. This replication is bi-directional. There is rudimentary conflict resolution at the file level, but no distributed locking or sharing mechanism at the file record level. Any changes to the repository on the EC2 instance is replicated to my PC and vise-versa. This allows me to use my PC as a work bench for scripting and post test analysis using my favorite tools and use the cloud for running large tests. More about this in a future post.

Ok, back to configuring the name server on the master node. After entering localhost in the Repository Host field, click the OK button. You must now restart the name server. To do so, right mouse on the name server icon and select "shutdown". Once the name server icon disappears, launch the name server again (start->All Programs->OpenSTA->OpenSTA Name Server). Verify it is configured correctly by right mousing on the name server icon and selecting "registered objects". You should see something like this:


Note the value 10_209_67_50. It is based on the EC2 private ip address for the master instance we just configured. Remember the IP address 10.209.67.50. It is the master node IP address and we are going to need it in a few minutes as we repeat this process on each slave instance we started. Remember, the master node holds the repository. The only difference between a master node and a slave node is that a slave node has a remote server IP or Network name as a "Repository Host" in the name server dialog box.

Next, create an RDP session to slave1. I prefer to RDP from the master node to each of the slaves. If using a lot of slaves, run elasticfox on the master node, highlight ALL slaves in the instances pane, right mouse over the multiple selected instances and select Connect To Instance. This will start as many RDP sessions as you have slaves. All you need to do is manually type in the user name and password.

Upon logging in to each slave, you will be we are greeted with the same error message about the name server exiting. Repeat the steps outlined above to reconfigure the slave's name server but this time specify the master node's private IP address (in this example 10.209.67.50) as repository host in the name server configuration dialog. Next shutdown the name server and restart it. Give the Slave's name server a couple of minutes to complete its process of registering with the master node.

This process needs to be repeated for every slave instance. Once you have logged into the slave, leave the RDP session going since logging out will stop the name server. I prefer to initiate the RDP sessions from the master node, and keep just one RDP session from my PC to the master up to keep clutter at a minimum. Keep in mind that if you disconnect the RDP session the remote login will remain. Just don't log off from the remote slave. There may be a way to run the name server as a service, but that will take more work. Should I find a way, I will blog about it and likely rework this portion of the guide.

When finished with all the slaves, we can use OpenSTA commander on the master node to verify what servers have joined this cluster of master and slaves. To do so, in commander, tools->Architecture Manager which shows the following display. Note the top node is master, the slave we just configured appears below it. Focusing on any node in the list shows details like computer name (important, we'll need this later), OS info, memory, number of processors, etc. Here is what it looks like;


The top server in the list is the master. The second node is our first slave. Clicking on any server in the list will display information about that system including its computer name, OS info, memory available, etc.

This process takes about 5 minutes to configure a handful of servers. The process sounds complicated but can be summed up succinctly as; Connect to the master node and configure the name server's "repository host" to be local host and restart the name server. Next, connect to each slave and configure the name server's "repository host" to be the (private) IP address of the master node and restart the name server. Verify all nodes are configured correctly with menu option tools->Architecture Manager in Commander.

At this point, you are ready to run multi-injector tests in the cloud which we will do in my next installment.

(continued in part 3)


Bernie Velivis, President Performax Inc

Monday, December 14, 2009

Using OpenSTA in the Amazon EC2 (part 1)

EC2, what is it? Amazon Elastic Compute Cloud consists of leased computers running virtual machines. It offers virtually unlimited compute and network scalability, on the operating system of your choice, on demand, dirt cheap. Read more about getting started with EC2 here.

OpenSTA, what is it? OpenSTA is a distributed software load testing tool designed around CORBA.  The current toolset has the capability of performing scripted HTTP and HTTPS heavy load tests with performance measurements from Win32 platforms. OpenSTA is open source and totally free (well, free in the sense that puppies are free... training, support, and maintenance are available at additional cost.)

Why OpenSTA on EC2? To be able to run 10's of thousands of virtual users with as much network bandwidth as you want for about $10 PER DAY for each 1,500 virtual users.

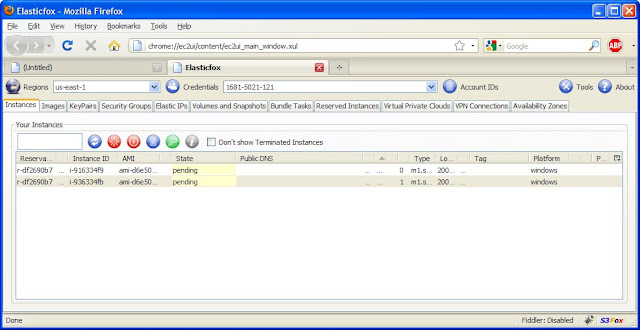
Interested? Good, then lets get to it. The first step is installing the  Elasticfox and the S3 organizer plug-ins for Firefox. Elasticfox allows you to start, save, reboot, and terminate AMIs (Amazon EC2 machine instances, a VM image). S3 organizer allows you to create and manage permanent storage. AMIs are stored in S3 "buckets". Each time you start an AMI from Elasticfox, it reverts to the state it was when the AMI was bundled (amazon speak for "saved") to an S3 bucket. I created a private AMI using the current beta release of OpenSTA running on Windows Server 2003. Here is a screen shot of Elasticfox.


Once the AMI was started, I logged in, installed OpenSTA and some other software I'll describe later and then created an S3 bucket (performax-opensta-v11) to make a permanent copy of my changes.


When you have the AMI in the state you want, use Elasticfox to bundle (save) it to the bucket you just created using the S3 Organizer. To do this, goto the instances pane in Elasticfox, right mouse over the running instance, and 'bundle into an AMI' specifying the name of the S3 bucket you just created. Its a little confusing the first time you do this, but hang in there, all things seem hard until they become easy. I'm glossing over a few details here, but this is not meant to be a tutorial on Elasticfox and S3.

Once the AMI is created, you can start as many instances as you like. By default, they will all be standalone instances but can be configured to work with one another in a master/slave relationship as long as they are started in the same region. OpenSTA states that servers need to be on the same subnet to cooperate as multiple injectors for the same test. My experience is that as long as they are on the same LAN and can multi-cast messages to one another, they can cooperate with one another. To start one or more instance of the OpenSTA AMI you created, goto the Elasticfox pane for images, filter on "My AMIs" to see only your AMIs, right mouse on the AMI and select "Launch instance(s) of this AMI" which will bring up a dialog for starting instances.


In this example I have selected Instance type m1.small. This creates a single CPU instance with enough compute capacity and memory to handle all but the most compute intensive scripts. Larger instances cost about 4 times as much, so use the small ones unless you know you need more.

In this example, I set maximum number of instances to 2 and specified the Availability Zone us-east-1d to be sure they are all started in the same physical location. I plan to create a two server instance capable of running up to 3000 virtual users and need both instances to be on the the same LAN. Its takes a good 15 to 20 minutes for windows AMIs to start. My next blog picks up after the AMI is started. Watch the state column in the instances tabs for progress.


Continued in Part 2


Bernie Velivis, President Performax Inc

Monday, December 7, 2009

A model for understanding throughput

I think a great mental model for understanding throughput and capacity planning is that of a highway and toll system.

Cars represent the demand as they travel between points A and B. The highway lane(s) and toll booth(s) between A and B are the service centers where cars spend their time traveling. The highway speed limit and service time of cars at the toll booths quantify efficiency. The number of lanes and toll booths quantify parallelism.

As the system approaches its capacity limit, the queue for the toll booth(s) will grow as cars wait for service. If you want to measure the throughput of the system, all you need to do is count cars as they leave the slowest resource, in this case the toll booth(s).

Shrini's client wants to increase throughput. His highly dubious colleague suggested adding more cars. Lets run that idea through the mental model. First 2 numbers, speed limit on the single lane, single booth highway is 100 kph, and the tool booth take 20 seconds to service a car. The capacity is this system is limited by the slowest resource, in this case 3 cars a minute. If you stand at the end of the highway and count cars, you will count a maximum of 3 cars a minute.

But lets not confuse capacity with throughput. Capacity is what CAN flow through the system. Throughput is what IS flowing through the system. If the flow of cars is 2 cars per minute on this highway, then ADDING CARS will indeed increase throughput! So, depending on the initial conditions, adding demand could increase throughput.

If the system is operating at it's capacity limit, then adding cars will do nothing for throughput, and in fact will only serve to increase the total service time for individual cars traveling from point A to B.

Now we have a good mental model to explore what happens as we increase the speed of our service centers (the highway speed limit and the tool booths).

Back to my original statement, it might be clearer that there are two options to increase throughput;

1) servicing individual requests faster (i.e. greater efficiency)
2) servicing more requests in parallel (i.e. greater concurrency)

You accomplish point 1 by increasing the speed limit or reducing time spent in the toll booths. You accomplish point 2 by adding highway lanes and adding toll booths.

To complete this mental model, we need to introduce some sort of contention for a shared resource. Lets imagine that as we go to multiple toll booths, each toll booth now must record the money collected using an accumulator so the greedy booth manager, Count D'Monet, knows the funds collected at any time. The booth sends a signal to an accumulator and can not release the car until the accumulator signals that the fare has been recorded. Lets say that the accumulator takes 4 seconds to perform its task and signal the booth to release the car.

With the new system you arrive at a toll booth and have to wait 20 seconds for normal service, 4 seconds for the accumulator AND some time waiting for the accumulator to service a car from the other lane (it is single threaded). How much additional time waiting? It depends on arrival patterns, but lets say on average you arrive half way through the accumulator servicing another car. That gives you 20 seconds of tool booth time plus 2 seconds waiting for the accumulator servicing another car plus 4 seconds for the accumulator servicing your car. That's 26 seconds. This is slowing YOU down!

But, the overall rate of cars clearing the toll boths is now 2 X 60/26 or 4.6 cars/min. An improvement over the 3 cars per minute we had before but not the factor of 2 you might expect by simply doubling the number of toll booths. Contention for shared resources is the counter balance to parallel processing. Continue adding toll booths and soon you get NO additional capacity for your effort. There is a fairly simple math function (A Taylor series minus one of the terms) that estimates the throughput of an N resource system given throughput of a 1 and 2 resource system, but I digress. Its also the reason why we don't have massively multi-core computer chips (not to be confused with massively parallel systems).

I love this model as it illustrates the fundamental principles of queuing theory. It shows, contrary to what has been said so far in this thread, your naive college could be right. But then again, even a broken clock is right twice a day.


Bernie Velivis, President Performax Inc

Performance testing strategies

I posted this on the OpenSTA mailing list a year or so ago. I've seen it posted in a few different places since then, so why not here from the source.

CAPACITY TESTING

If your goal is to determine the CAPACITY of the system under test, start by creating a "realistic" workload consisting of a mix of the most popular transactions plus those deemed critical or known to cause problems even when executed infrequently. Pick a manageable set of transactions to emulate (considering time, budget, and goals), determine the probability of executing each transaction, the work rate for the emulated users, and the "success criteria for performance metrics (i.e. response time limits, concurrent users, and throughput).


One way to implement this approach is to create a master script, assign it to each VU, and have it generate random numbers and then call other scripts which model the individual workload transactions based on a table of probabilities. The scripts should be modeled with think times consistent with the way your users interact with the system. This varies greatly from one application to another and unless you are mining log files from an application already in use, this is a somewhat subjective process. The best advice I can give in defining the workload is to get input from people who know how the application is (or will be) used, make conservative assumptions (but no so much so that the sum of all your conservative decisions is pathological), and balance the scope of the workload vs. time to complete the project. Another important consideration is the data demographics of the transactions and the size and contents of the database.

When it’s time to test, increase the number of emulated users and monitor how response times, server resource utilization (CPU, disk IO, network, and memory), and throughput (the rate of tasks completed system wide) vary with the increased load. You might construct a test that ramps up to a specific number of users, lets them run for a while, and then repeats as necessary. This way, you can observe the behavior of the system in various steady states under increasing load.

Workloads containing transactions having a low probability of being executed and/or a disproportionately large impact on the performance of other transactions usually need to run longer to reach a steady state. If you can't get repeatable results, your steady state interval might be too small. As a rule of thumb I would suggest a minimum ramp up time equal to the duration of the longest running script and the steady state observation period at least twice as long as the ramp up period. I also tend to ignore response times and performance statistics gathered during the ramp up periods and focus instead on the data collected during the steady state periods.

That's a rough outline of one approach to capacity testing which in summary is an attempt to load up the system with VUs in a way that is indistinguishable from a "real users" in order to find the capacity limit. Pick the wrong workload however and you might miss something very important or end up solving problems that won’t exist in the real world.

The end game here is to increase load until response times become excessive at which point you have found the system’s capacity limit. This limit will be due to either a hardware or software bottleneck. If time and goals allow, analyze the performance metrics captured, do some tuning, improve code efficiency or concurrency, or add some hardware resources. Make one change at a time and repeat as necessary until you meet capacity goals, find the limits to the architecture, or run out of time (which happens more then most performance engineers would like).

SOAK TESTING

The same scripts created for capacity testing can also be used for SOAK TESTING where you load up the system close to its maximum capacity and let it run for hours, days, etc. This is a great way to spot stability problems that only occur after the system has been running a long time (memory leaks are a good example of things you might find).

FAILOVER TESTING

Get the system under test into a steady state and start failing components (servers, routers, etc) and observe how response times are effected during and after the failover and how long the system takes to transition back to steady state and you are on your way towards FAILOVER TESTING. (A gross simplification and again there is lots of good reading material out there on failover and high availability testing).

STRESS TESTING

If your goal is to determine where or how (not if) the system will fail under load, then you are doing STRESS TESTING. One way to do this is to comment out the think times and increase VUs until something (hopefully not your emulator!) breaks. This is one form of stress testing, a valuable aspect of performance testing, but not the same as capacity testing. How the VUs compare to "real users" may be irrelevant as you are trying to determine how the system behaves when pushed past its limits.

A report illustrating how these concepts were used to performance test a SOAP application usingOpenSTA can be downloaded at:
http://iperformax.com/downloads/SamplePerformaxPerformanceReport.pdf


Bernie Velivis, President Performax Inc